
Refinement of Large-Scale Experimental Data
Normal Boiling Point Case
More than 1.5 million data points of the various properties of over 230,000 chemical compounds have been collected to establish reliable computational models. Before using them in the modeling procedure, the collected data have been refined systematically to determine reliable data points. The data refinement procedure includes basic analysis, statistical filtering, and similarity analysis, which are described below using normal boiling point as an example.
In the case of normal boiling point, 182,526 data points for 52,811 chemical compounds have been collected from 111,278 different sources including journal articles, scientific books, patents, and chemical databases. An overall scan of all the collected data is given in the chart below:
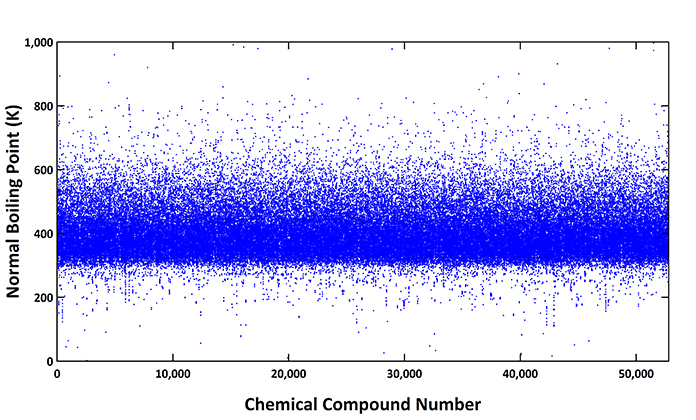
This chart shows the 182,526 data points in Kelvin (K) for each of 52,811 chemical compounds sorted based on the boiling point values in ascending order. Most of the values were observed to be distributed between 300 and 600 K
Basic Analysis
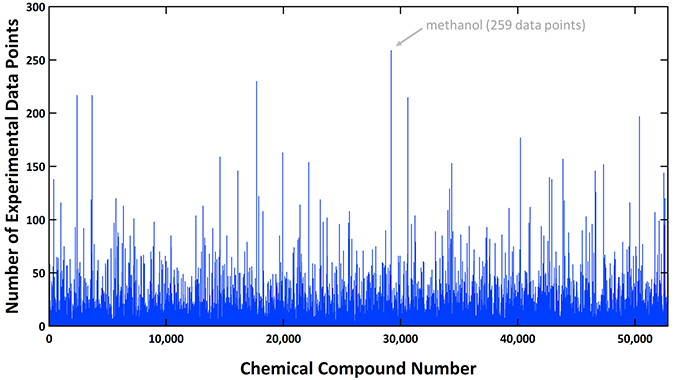
Multiple boiling points exist per single compound as the data are originated from many different sources. The chart below shows the number of data points collected per single compound, which is up to 259 points in the case of methanol.
Although normal boiling point is defined as one single value per compound, the deviations of the collected data are frequently significant. The chart below demonstrates the deviations of the normal boiling points of each compound from 5,000th till 6,000th compound zoomed in from the overall scan chart shown earlier. For each compound, minimum and maximum point are represented as little horizontal bars, which are connected by a vertical line showing the magnitude of deviation.
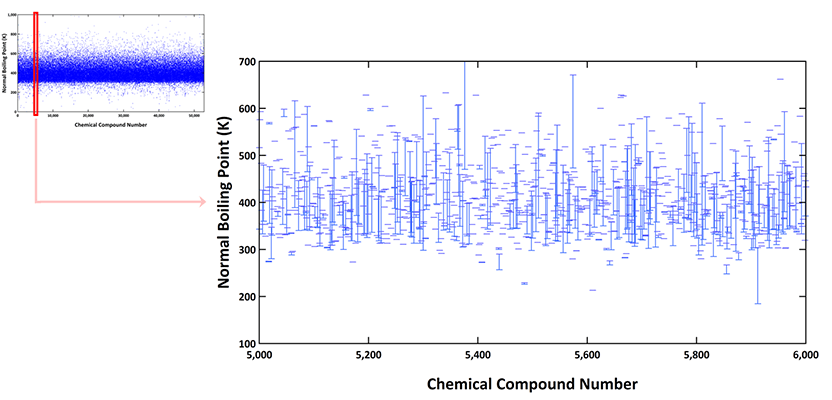
Analyzing each of the 52,811 compound cases, the deviation percentage, i.e., {(max – min)/max }x100 of each compound, spanned from 0.002 to 99.9%. The average deviation of the entire 52,811 cases was calculated to be 16.37% and the standard deviation was estimated to be 13.48%. This level of deviation is significantly higher than the reported experimental error of 2% if normal boiling point is measured by one fixed laboratory.
The sources of the data were therefore analyzed in detail by investigating how the collected data were determined. Any sort of predicted/estimated data or the data determined under different experimental conditions are excluded.
Statistical Filtering
The remaining multiple data points per compound are averaged, and a data point is eliminated if the deviation of the point from the average value exceeds certain percentage, e.g., 20 – 30%. Similar procedure continues – the rest of the data points are averaged again, and a data point is eliminated if the deviation of the point from the updated average value exceeds the deviation percentage lower than the previous step, e.g., 15 – 25%. This procedure continues until all the deviations of the remaining data points from the updated average value lie within a low enough percentage, e.g., 5 – 15%.
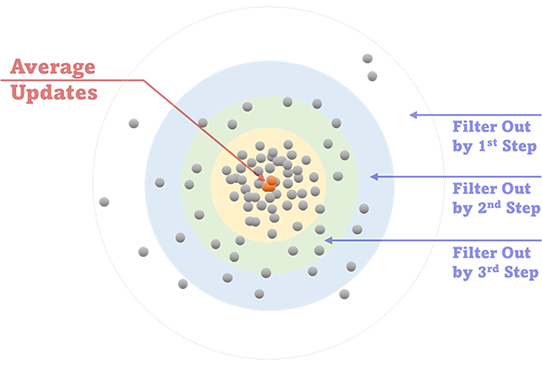
This procedure is performed on an automatic basis by use of a computer program developed in-house. The initial deviation percentage criteria (20 – 30% mentioned above as an example), the reduction of the deviation percentage criteria on each step (15 – 25% mentioned above as an example on the second step), and the final deviation percentage criteria (5 – 15% mentioned above as an example) are determined automatically or manually depending on the number of data points available on each step, the initial & updated deviation percentages of each data point on each step, and the initial & updated average values of the data on each step.
This filtering procedure is not applicable if the number of data points per compound is insufficient. The main objective is to eliminate obviously incorrect data from a statistical point of view if the number of available data per compound is large enough.
Similarity Analysis
This is to determine reliable data point(s) per compound based on so called ‘similarity analysis’ using the data points that passed the filtering procedure. The normal boiling points of a series of chemical compounds within a similar functional group or family are plotted and a trend curve is generated. Then the refined data are obtained based on the trend curve.
The chart below demonstrates the similarity analysis for normal alkanes as an example. The boiling points of normal alkanes after the statistical filtering are plotted as a function of the number of carbon atoms from 1 for methane, 2 for ethane, and up to 44 for tetratetracontane.
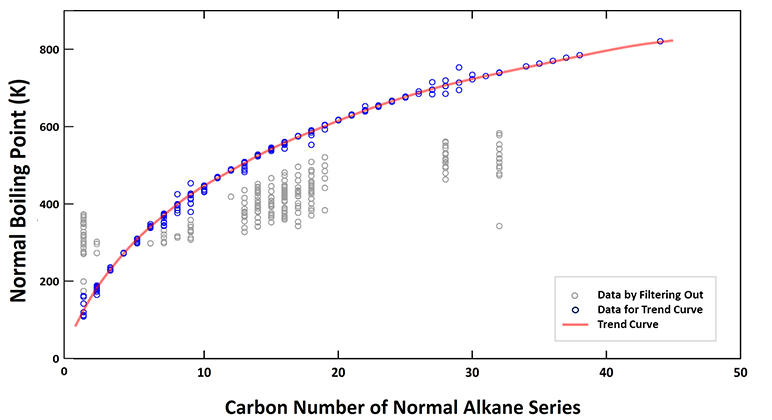
The data points in grey are excluded by the filtering procedure, and the points in blue are used for generating the trend curve. The refined normal boiling points of each alkane are obtained based on the trend curve, which are used to investigate the nature of the normal boiling points.
Obtaining the trend curve is not always straightforward. Depending on the type of similar chemical compounds and the corresponding available data points, the statistical filtering and the trend curve generation need to be iterated with different deviation percentage criteria.
It has been concluded that any published data may contain significant errors. The data need to be checked carefully if they are estimated or experimental, and if experimental, what the experimental conditions were. Multiple data points of the identical compound and the data of the similar compounds need to be collected, analyzed, and cross checked to secure the reliability of the data.