
IR Spectra for 1-butanol Based on Quantum Chemical Computation
Search Additional Chemical Compound to Get Its Spectra & Vibration Animation
Leveraging our patented QSQN technology, we have precisely determined the IR spectroscopy and the corresponding vibration animation for 1-butanol. These detailed analyses are now available for purchase. For a deeper understanding of our determination process and the innovative technology behind it, we invite you to visit our dedicated IR spectra webpage:
IR Spectra Data & Chart
The detailed IR spectroscopy chart and data for 1-butanol are readily available for purchase. You can find them in the table below, specifically under the "Spectra Data" tab. Our web-based graphical user interface (GUI) presents the IR spectrum chart in a user-friendly format. This chart offers features such as zoom-in and zoom-out capabilities, allowing for close inspection and broader overview. It also includes options for normalization, scaling factor adjustment, and displays the full width at half maximum (FWHM) among other functionalities. For added convenience, the IR spectroscopy data can be downloaded as a JDX (JCAMP Chemical Spectroscopic Data Exchange Format) file. To acquire the IR spectroscopy chart and data for 1-butanol, simply click the “Buy Now” button.

| Chemical Formula | C4H10O |
|---|---|
| Molecular Weight | 74.1216 g/mol |
| IUPAC Name | butan-1-ol |
| SMILES String | CCCCO |
| InChI | InChI=1S/C4H10O/c1-2-3-4-5/h5H,2-4H2,1H3 |
| InChIKey | LRHPLDYGYMQRHN-UHFFFAOYSA-N |
chemical table area

If you're interested in experiencing our data before making a purchase, you are welcome to try out a free sample with one of our sample compounds. Here's how you can access it (also see our Video Guide for assistance):
-
1.
Visit our sample compounds page.
-
2.
Select one of the compound by clicking on one of the images or the “View our data” button.
-
3.
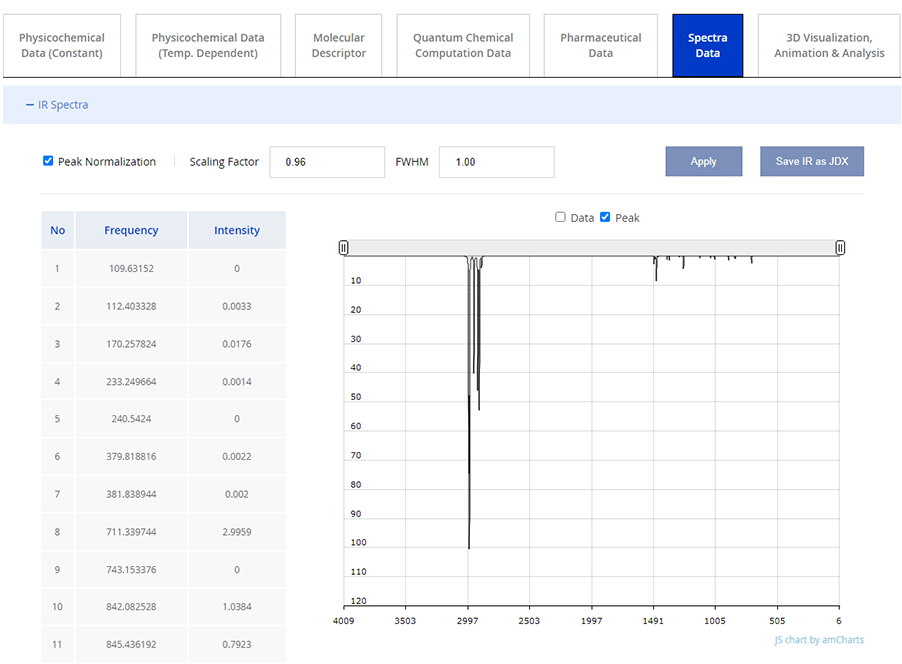
Navigate to “Spectra Data” tab and IR Spectra.
Following these steps, you will be presented with a complete IR spectra data table and the corresponding chart, similar to the image below:
Vibration Animation
The vibration animation corresponding to the IR spectroscopy of 1-butanol is also available for purchase. You can find this feature under the "3D Visualization, Animation & Analysis" tab, as shown below. To acquire this detailed animation, simply click the “Buy Now” button.
| Chemical Formula | C4H10O |
|---|---|
| Molecular Weight | 74.1216 g/mol |
| IUPAC Name | butan-1-ol |
| SMILES String | CCCCO |
| InChI | InChI=1S/C4H10O/c1-2-3-4-5/h5H,2-4H2,1H3 |
| InChIKey | LRHPLDYGYMQRHN-UHFFFAOYSA-N |
chemical table area
For those interested in exploring our offerings before purchase, we provide the option to try free sample data. To access this, follow these simple steps (also see our Video Guide for detailed instructions):
-
1.
Navigate to our sample compounds page.
-
2.
Select one of the compound by clicking on one of the images or the “View our data” button.
-
3.
Go to the “3D Visualization, Animation & Analysis” tab.
-
4.
Under this tab, click on the “Vibration Animation” menu located on the left.
-
5.
Choose one of the frequencies and click the “Animate” button.
Then the corresponding vibration motion is animated accordingly, which shows similar to the following image:
The 3D representation of the molecule offers interactive features for an enhanced viewing experience. By clicking and dragging your mouse, you can rotate the molecular image to view it from different angles. Additionally, the mouse wheel allows for zoom functionality; you can enlarge or reduce the size of the molecule simply by scrolling. Users also have the flexibility to adjust the scale and speed of the vibrational motion. Furthermore, you can access mode information and even alter the arrow representation to a 3D form for a more in-depth analysis.
Search for More IR Spectra & Vibration Animation
To discover the IR spectroscopy and corresponding vibration animation for other chemical compounds, simply enter the compound's name, CAS number, or another identifier in the search bar below. Our extensive database covers a wide range of compounds, providing detailed spectral and vibrational data at your fingertips.
Search Another Chemical Compound to Get Its IR Spectra & Vibration Animation
Input example for Ethanol:
- Name: ethanol
- CAS #: 64-17-5
- Formula: C2H5OH
- Smiles: CCO
- InChI: InChI=1S/C2H6O/c1-2-3/h3H,2H2,1H3
- InChIKey: LFQSCWFLJHTTHZ-UHFFFAOYSA-N
Pre-packaged Datafile
For professionals in cutting-edge areas like Chemical AI, acquiring a vast quantity of IR spectra data for numerous chemical compounds can be a challenging and time-intensive endeavor. To facilitate this process, we offer pre-packaged datafiles available in both Excel and CSV formats, which are customizable to suit your specific needs.
If you require extensive data points across a diverse range of chemical compounds, please do not hesitate to contact us for a tailored quote at DeepData@mol-in.com. Our team is dedicated to supporting your comprehensive data requirements and ensuring a streamlined experience.
141
The contents of this page can freely be shared if cited as follows:
Source: Chemical Compounds Deep Data Source (CCDDS; https://www.molinstincts.com) based on 41 patented QSQN and QN
technology
commercialized into Mol-Instincts database and ChemRTP, ChemEssen, Inc (2024).